


Build the dashboard your agency actually runs on.
What it is
Drag, drop and resize 50+ data-rich widgets into dashboards that fit how your agency works. Track KPIs, run leaderboards, set goals, surface tasks, and give every person at every level a view of their own performance.
Who benefits
Agency Director. See the full picture, branch by branch. Track the numbers that matter to the business and set the goals that shape next quarter.
Branch Manager. Run a leaderboard, spot who's ahead of target, and coach the people who aren't. All from one screen.
Negotiator. Open your personal dashboard and see exactly what you've done, what you're chasing, and what's next.
50+ widgets
Pre-built KPI, goal, leaderboard, and task widgets. Drop them in, move them around, resize them.
Unlimited dashboards
Build one for the business, one for each branch, one for each team, one for each person.
Any level
Director, manager, negotiator, admin. Everyone gets the view that matches their job.
A good dashboard is the one your team actually looks at. Build yours around the numbers that move the business.
Your numbers, the way your agency reads them.
Build the dashboards, set the goals, run the leaderboards. Everyone sees what they need to see.

Drag. Drop. Resize. Done.
Start from a blank canvas or an existing dashboard, pull in the widgets you want, arrange them however makes sense, and save. No spreadsheet to rebuild on Monday morning.
- Drag and drop layout: Move widgets around the dashboard until the layout reflects how you actually read the data.
- Resize on the canvas: Stretch a leaderboard full-width, shrink a task list to a corner. The dashboard adapts to what matters most to you.
- Unlimited dashboards: Build as many as you need. One for the business. One for each branch. One for each person. One for a specific campaign.
- Save and share: A dashboard built for a role or a team can be reused across the people who do that job. Build once, share widely.

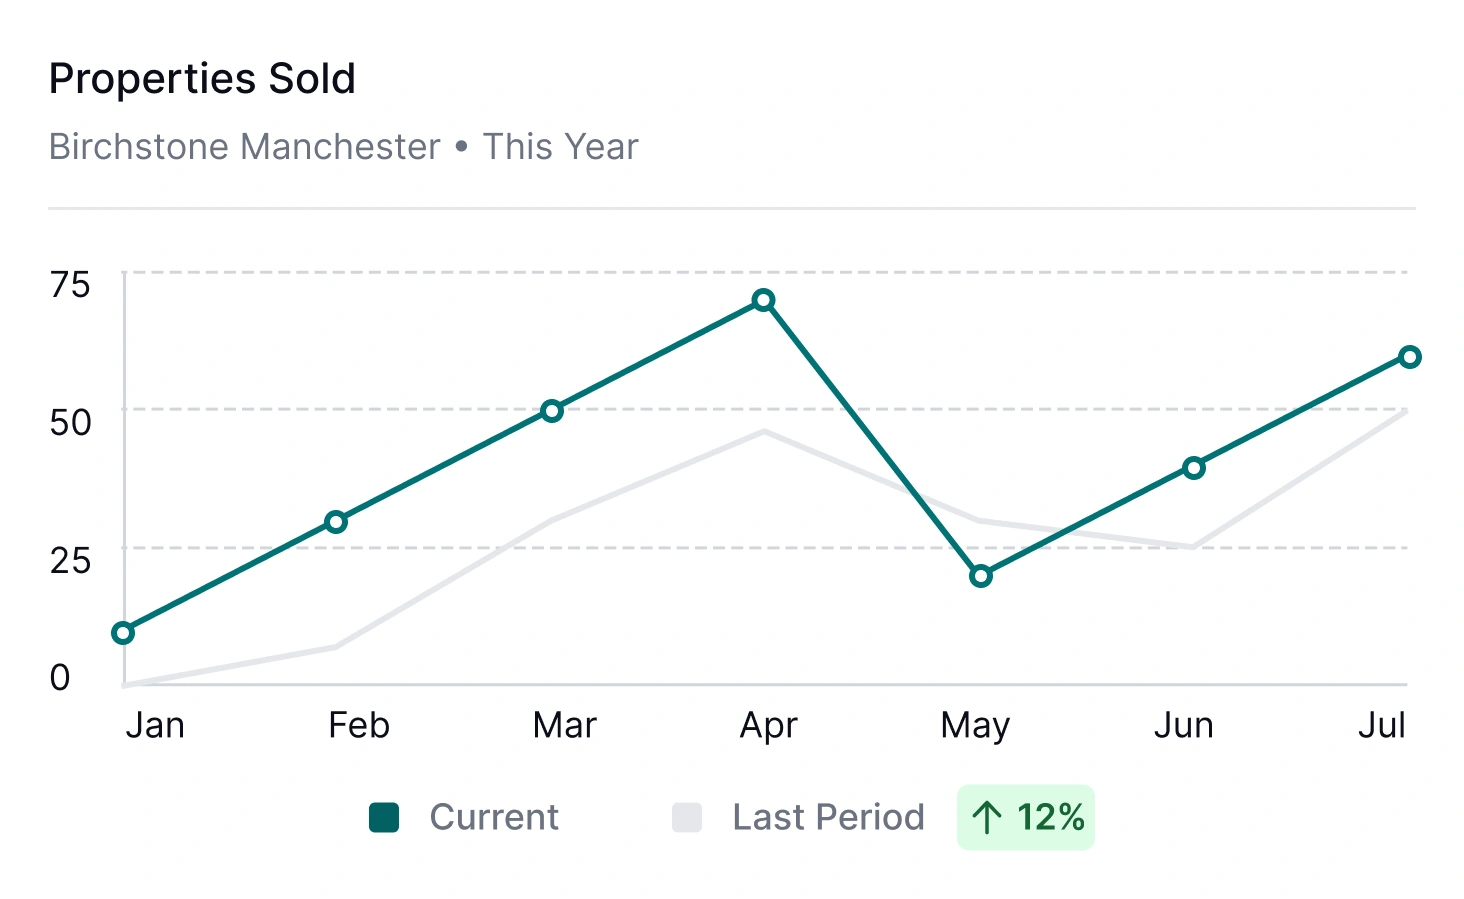
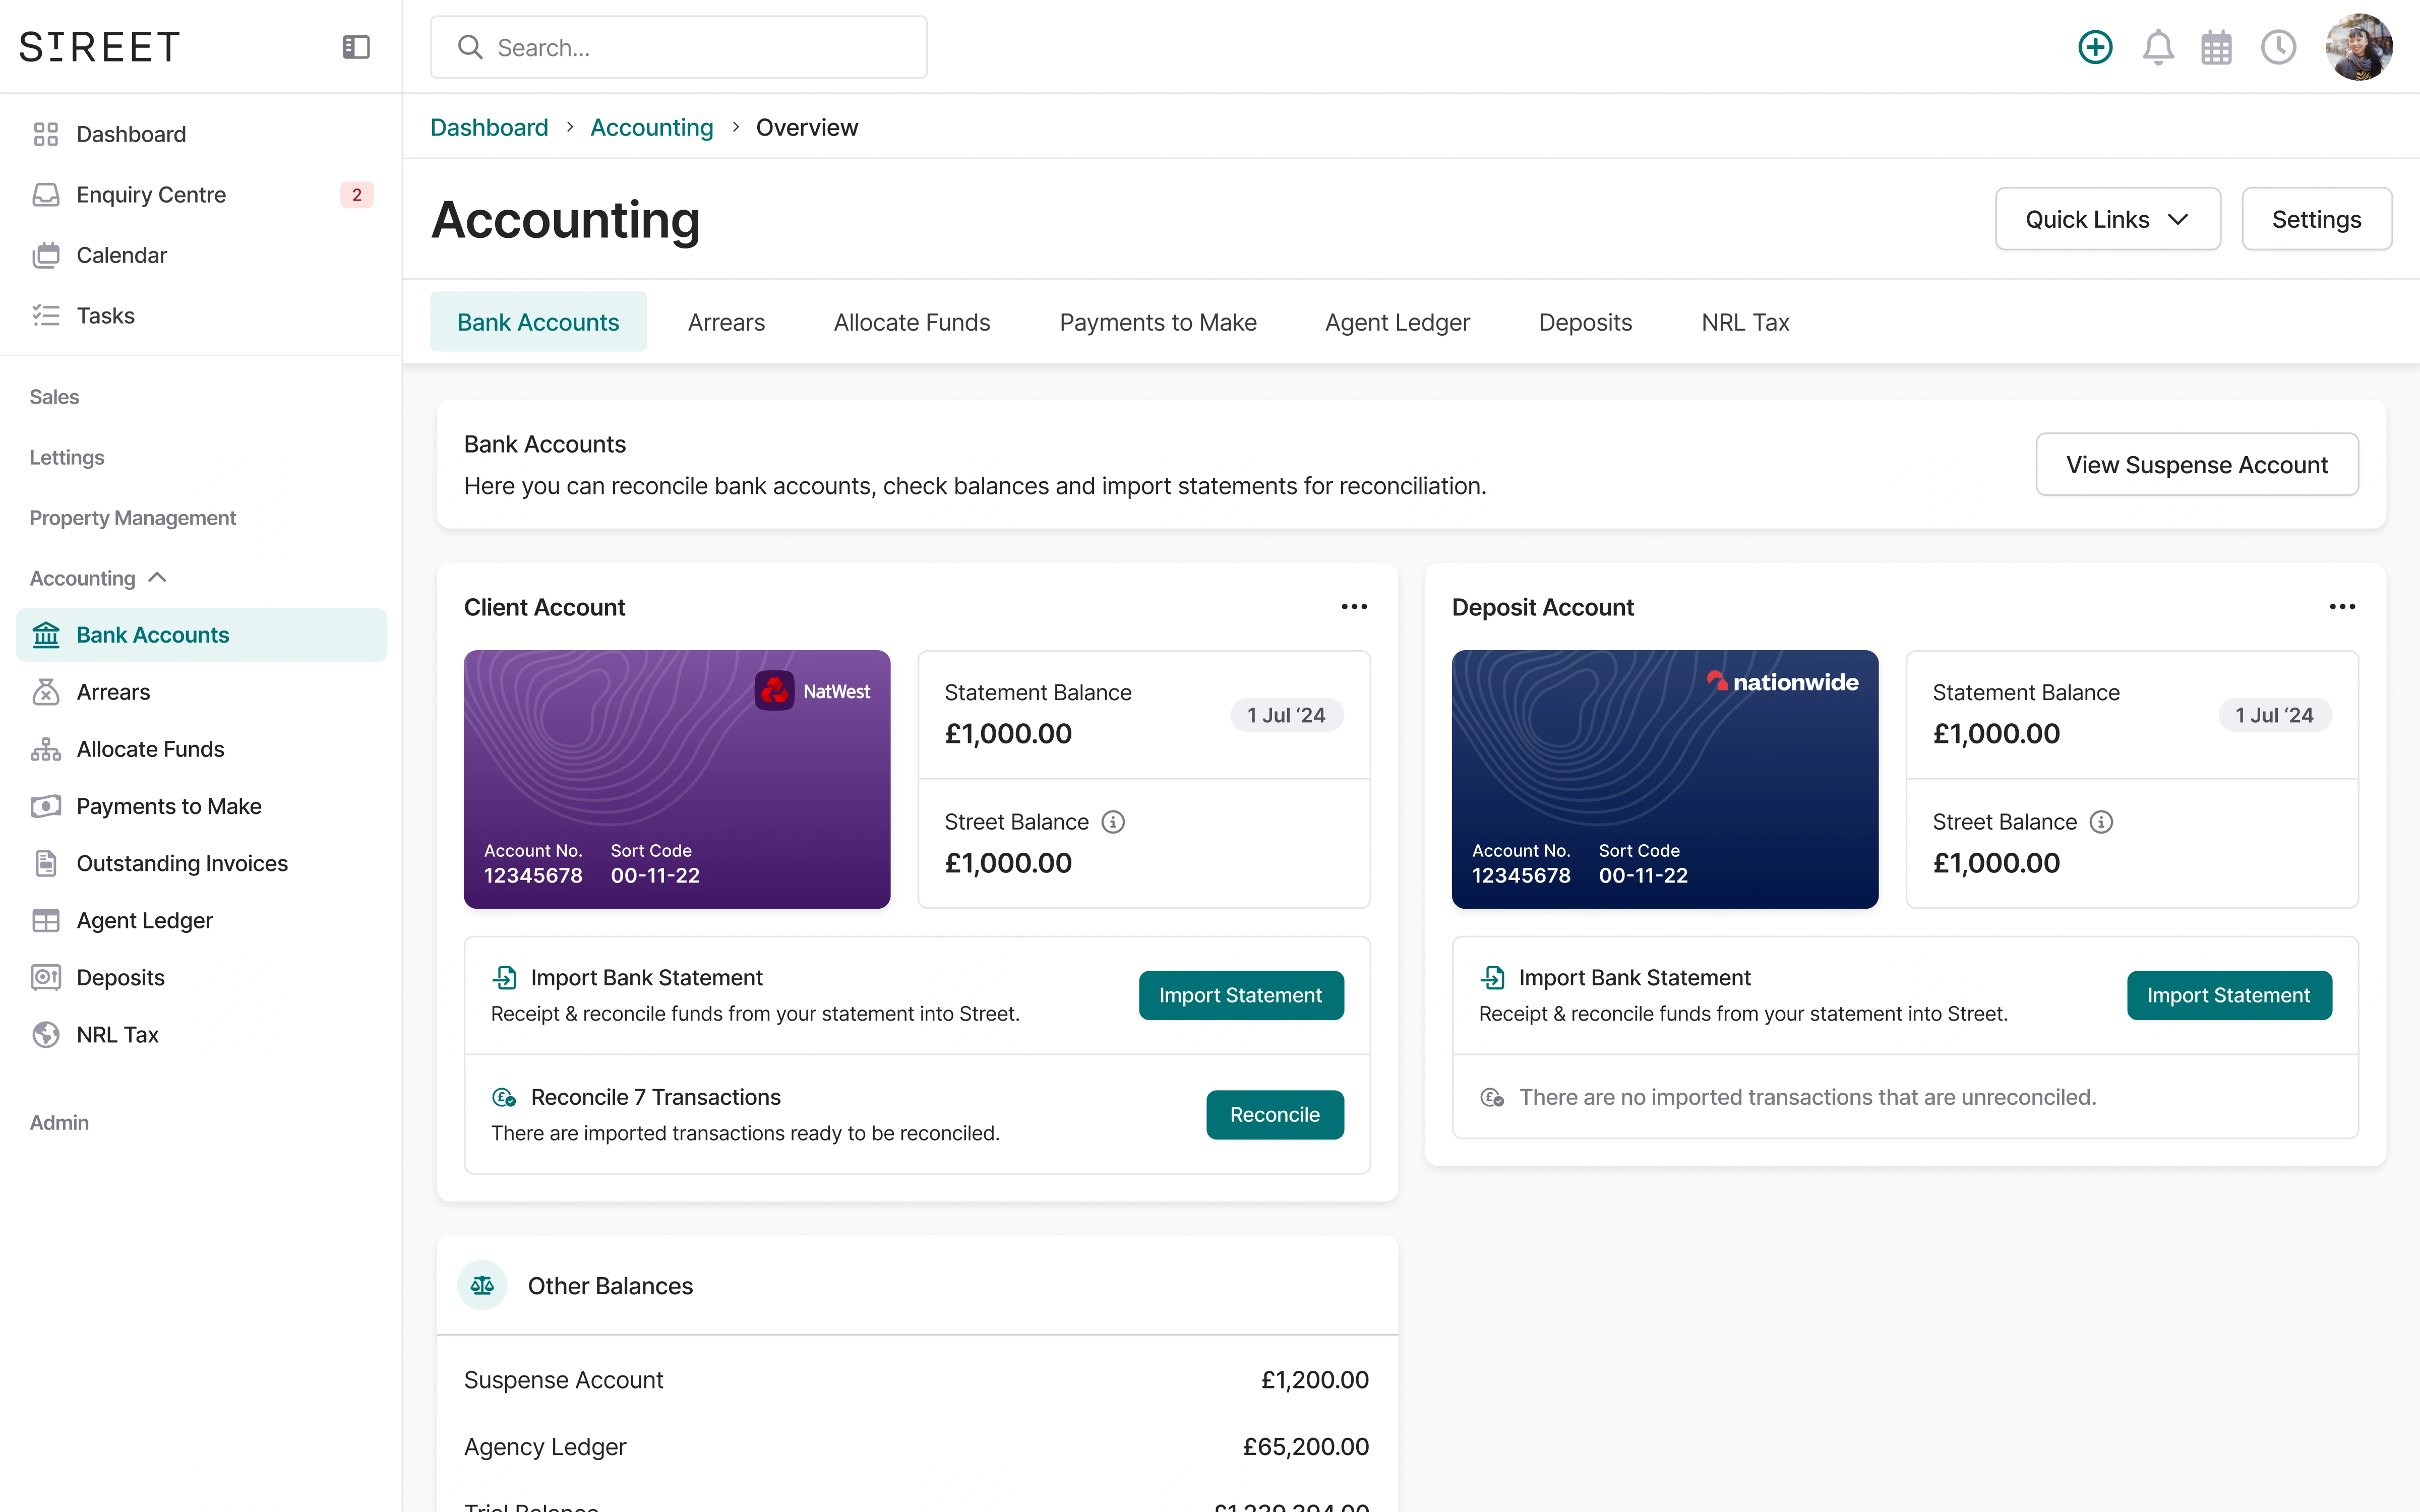
See the numbers that move the business.
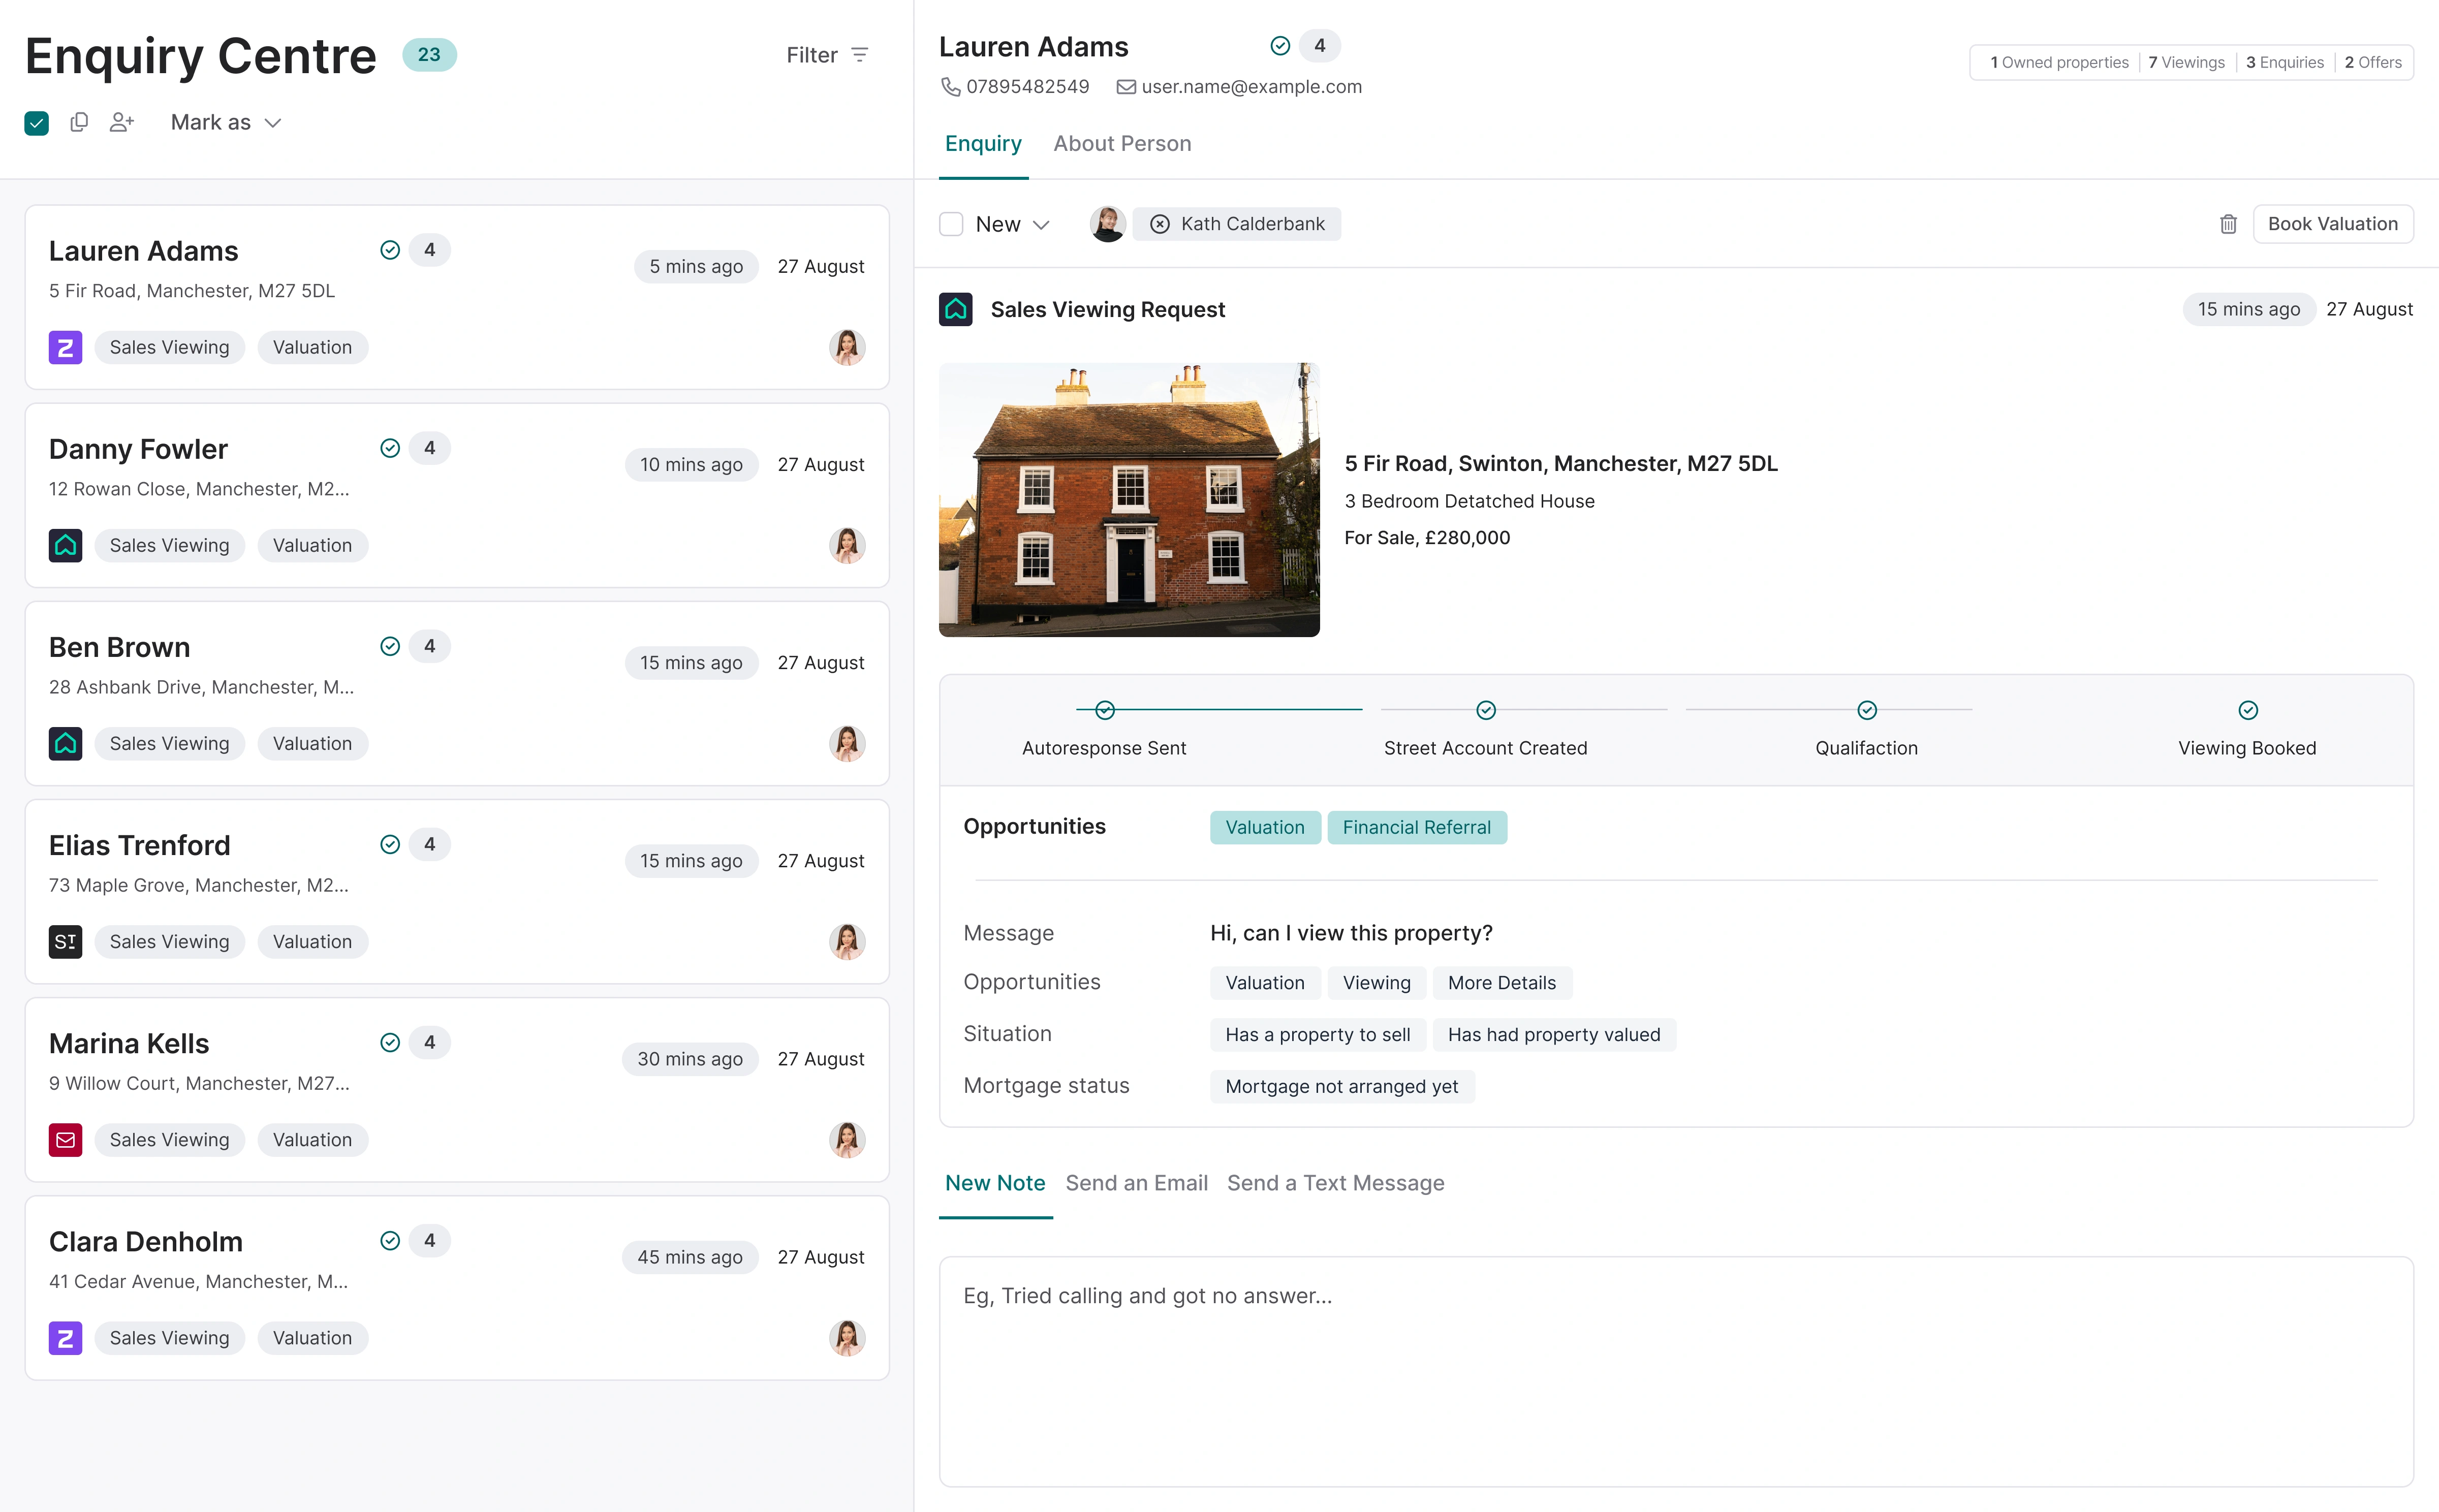
Instructions. Viewings. Offers. Fall-throughs. Fee income. Every core metric is available as a widget, ready to drop onto a dashboard at any level of the business.
- Sales performance: Track instructions, offers, sales agreed, exchanges, completions. By agent, by branch, by company.
- Lettings performance: Pipeline, move-ins, renewals, arrears. All live against your lettings data in Street.co.uk.
- Filterable views: Slice a widget by branch, team or date range. One widget, many questions answered.
- Always live: Dashboards read from your Street.co.uk data directly. No overnight refresh, no stale numbers.

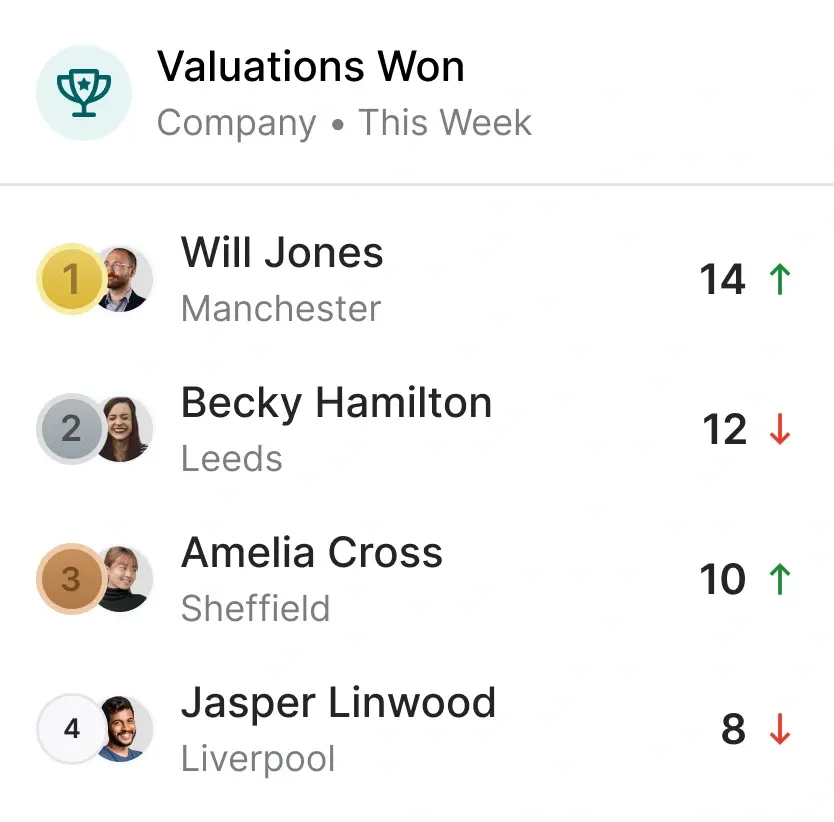
Healthy competition, on the dashboard.
Drop a leaderboard widget onto any dashboard, pick the metric, and see who's leading. It works for individuals, teams and branches. A quiet way to surface the month's top performer, or a loud one, depending on your style.
- Leaderboard widgets: Rank by instructions, offers, sales agreed, fee income, viewings booked, or any other trackable metric.
- Any level: Agents against agents. Branches against branches. Teams against teams. Whichever comparison is useful.
- Filter the field: Scope the leaderboard to a date range, a branch, a team. The dashboard can tell any of several stories on demand.
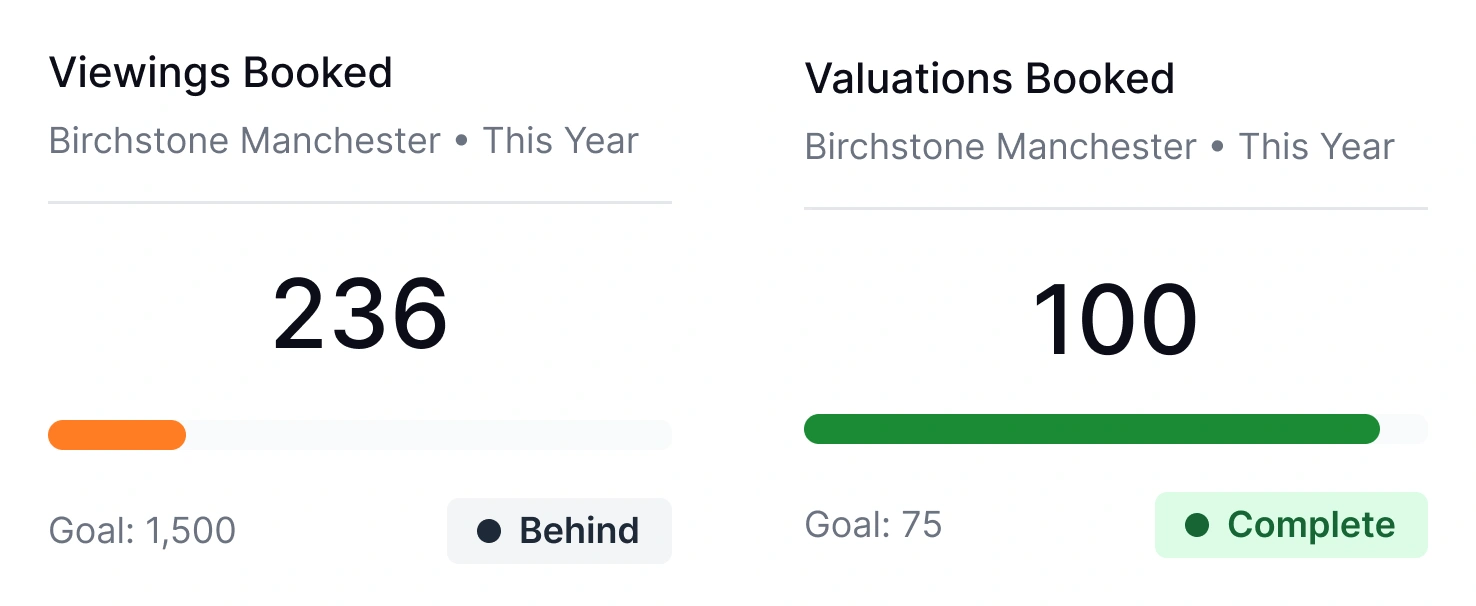
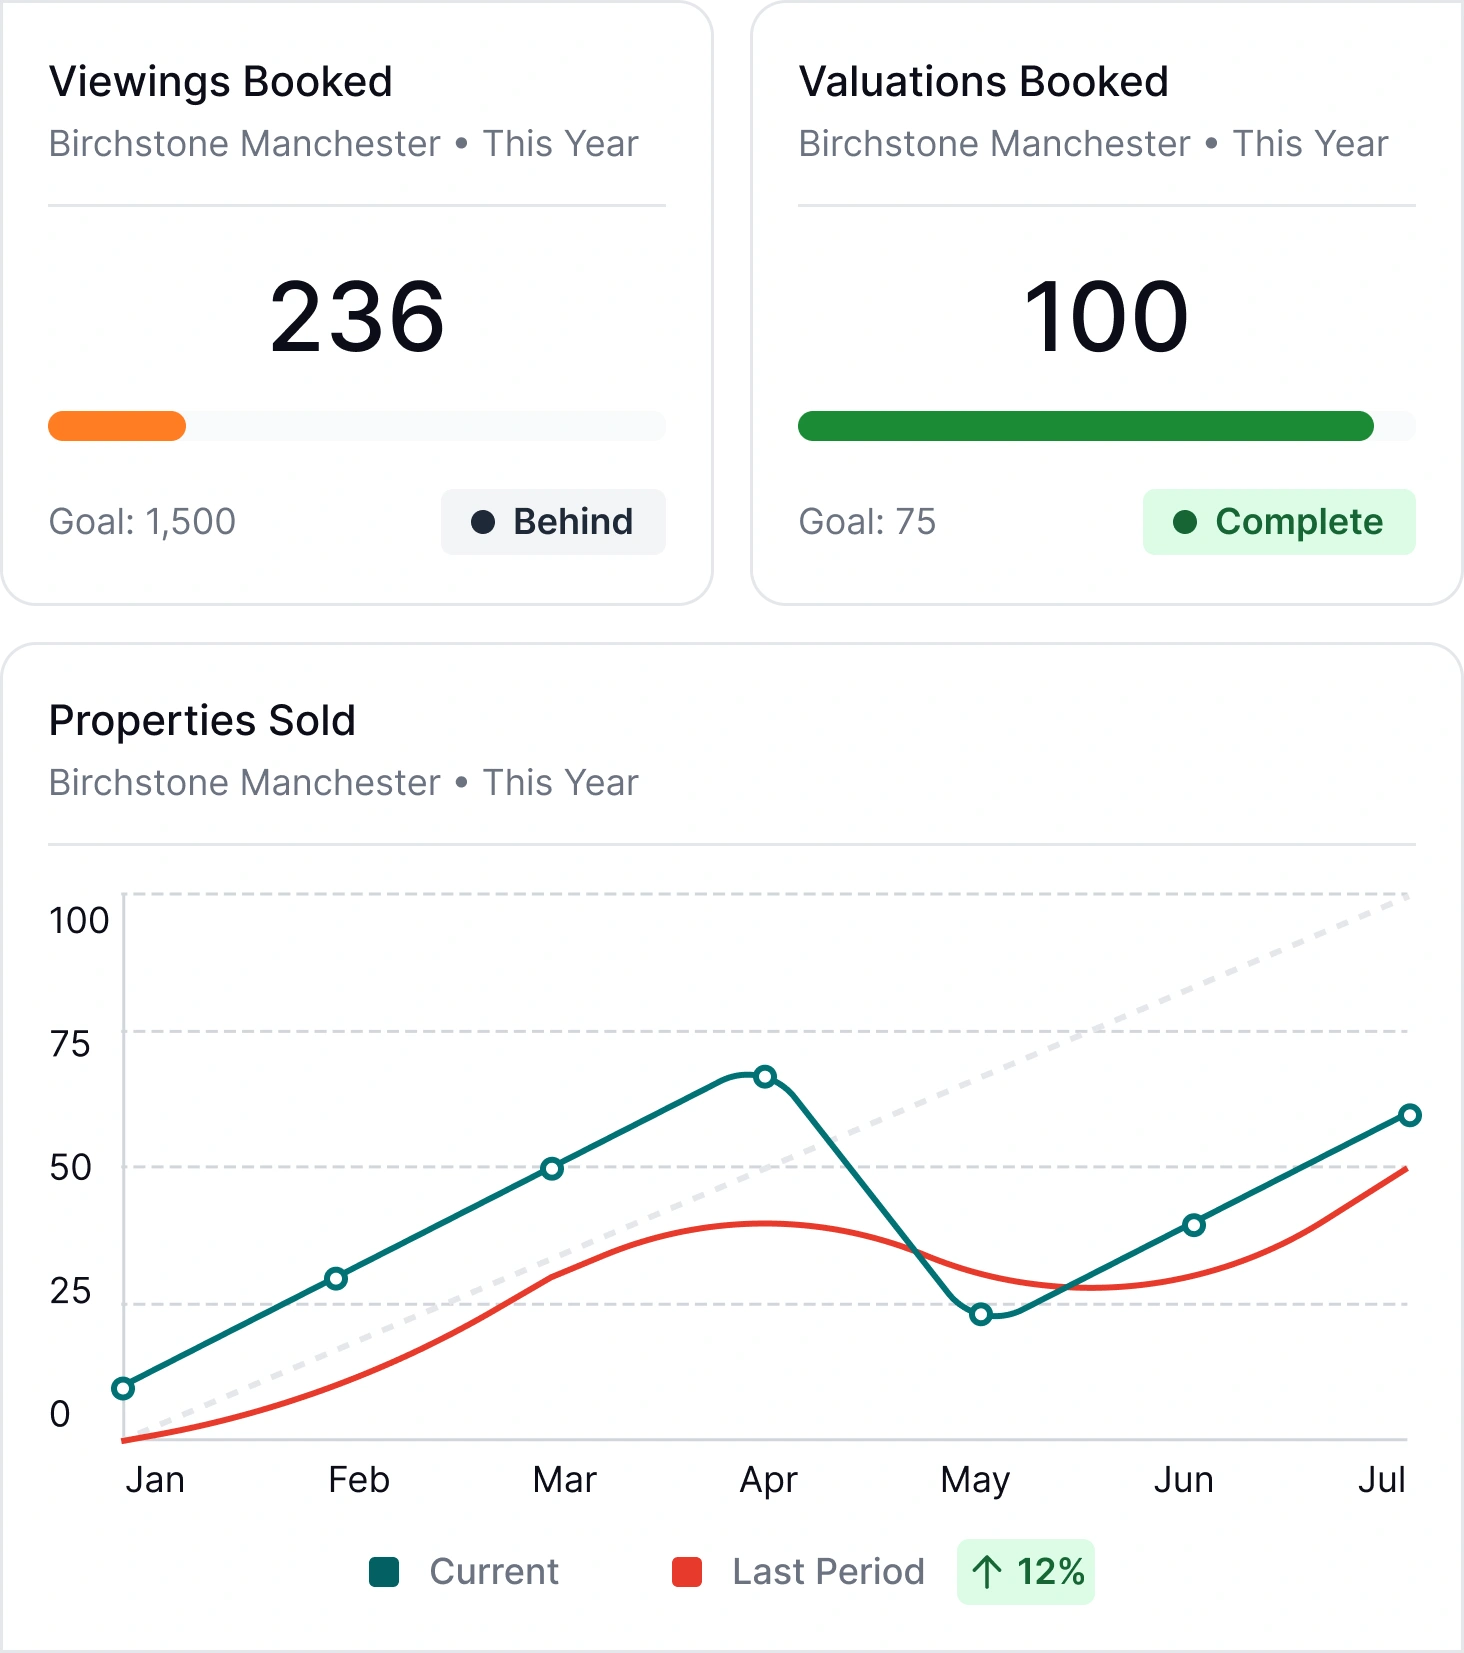
Set the target. Watch it move.
Set goals at any level, from company down to person, and track progress on the same dashboard the work is happening on. Goal widgets show where you are, where you need to be, and how much of the period is left.
- Set in a click: Define a goal against any trackable metric, assign it to a person, team, branch or the company, and it's live.
- Personal goals: Individual targets show on a negotiator's own dashboard, so the progress lives where the work does.
- Business objectives: Run company-wide goals that show on every relevant dashboard. The whole agency rowing the same way.
- Live progress: A goal widget updates as the data does. You always know how far along you are without running a report.
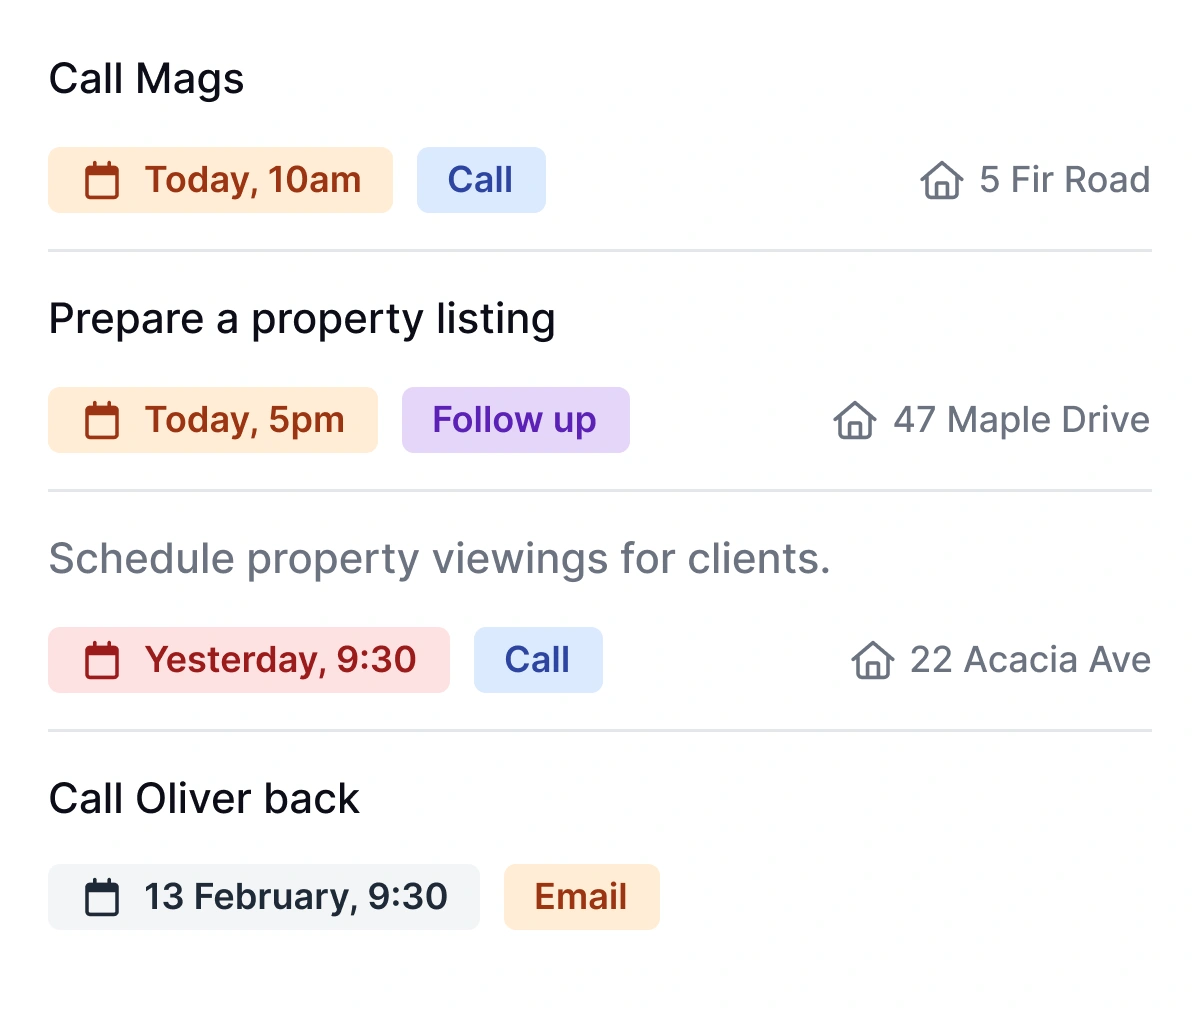
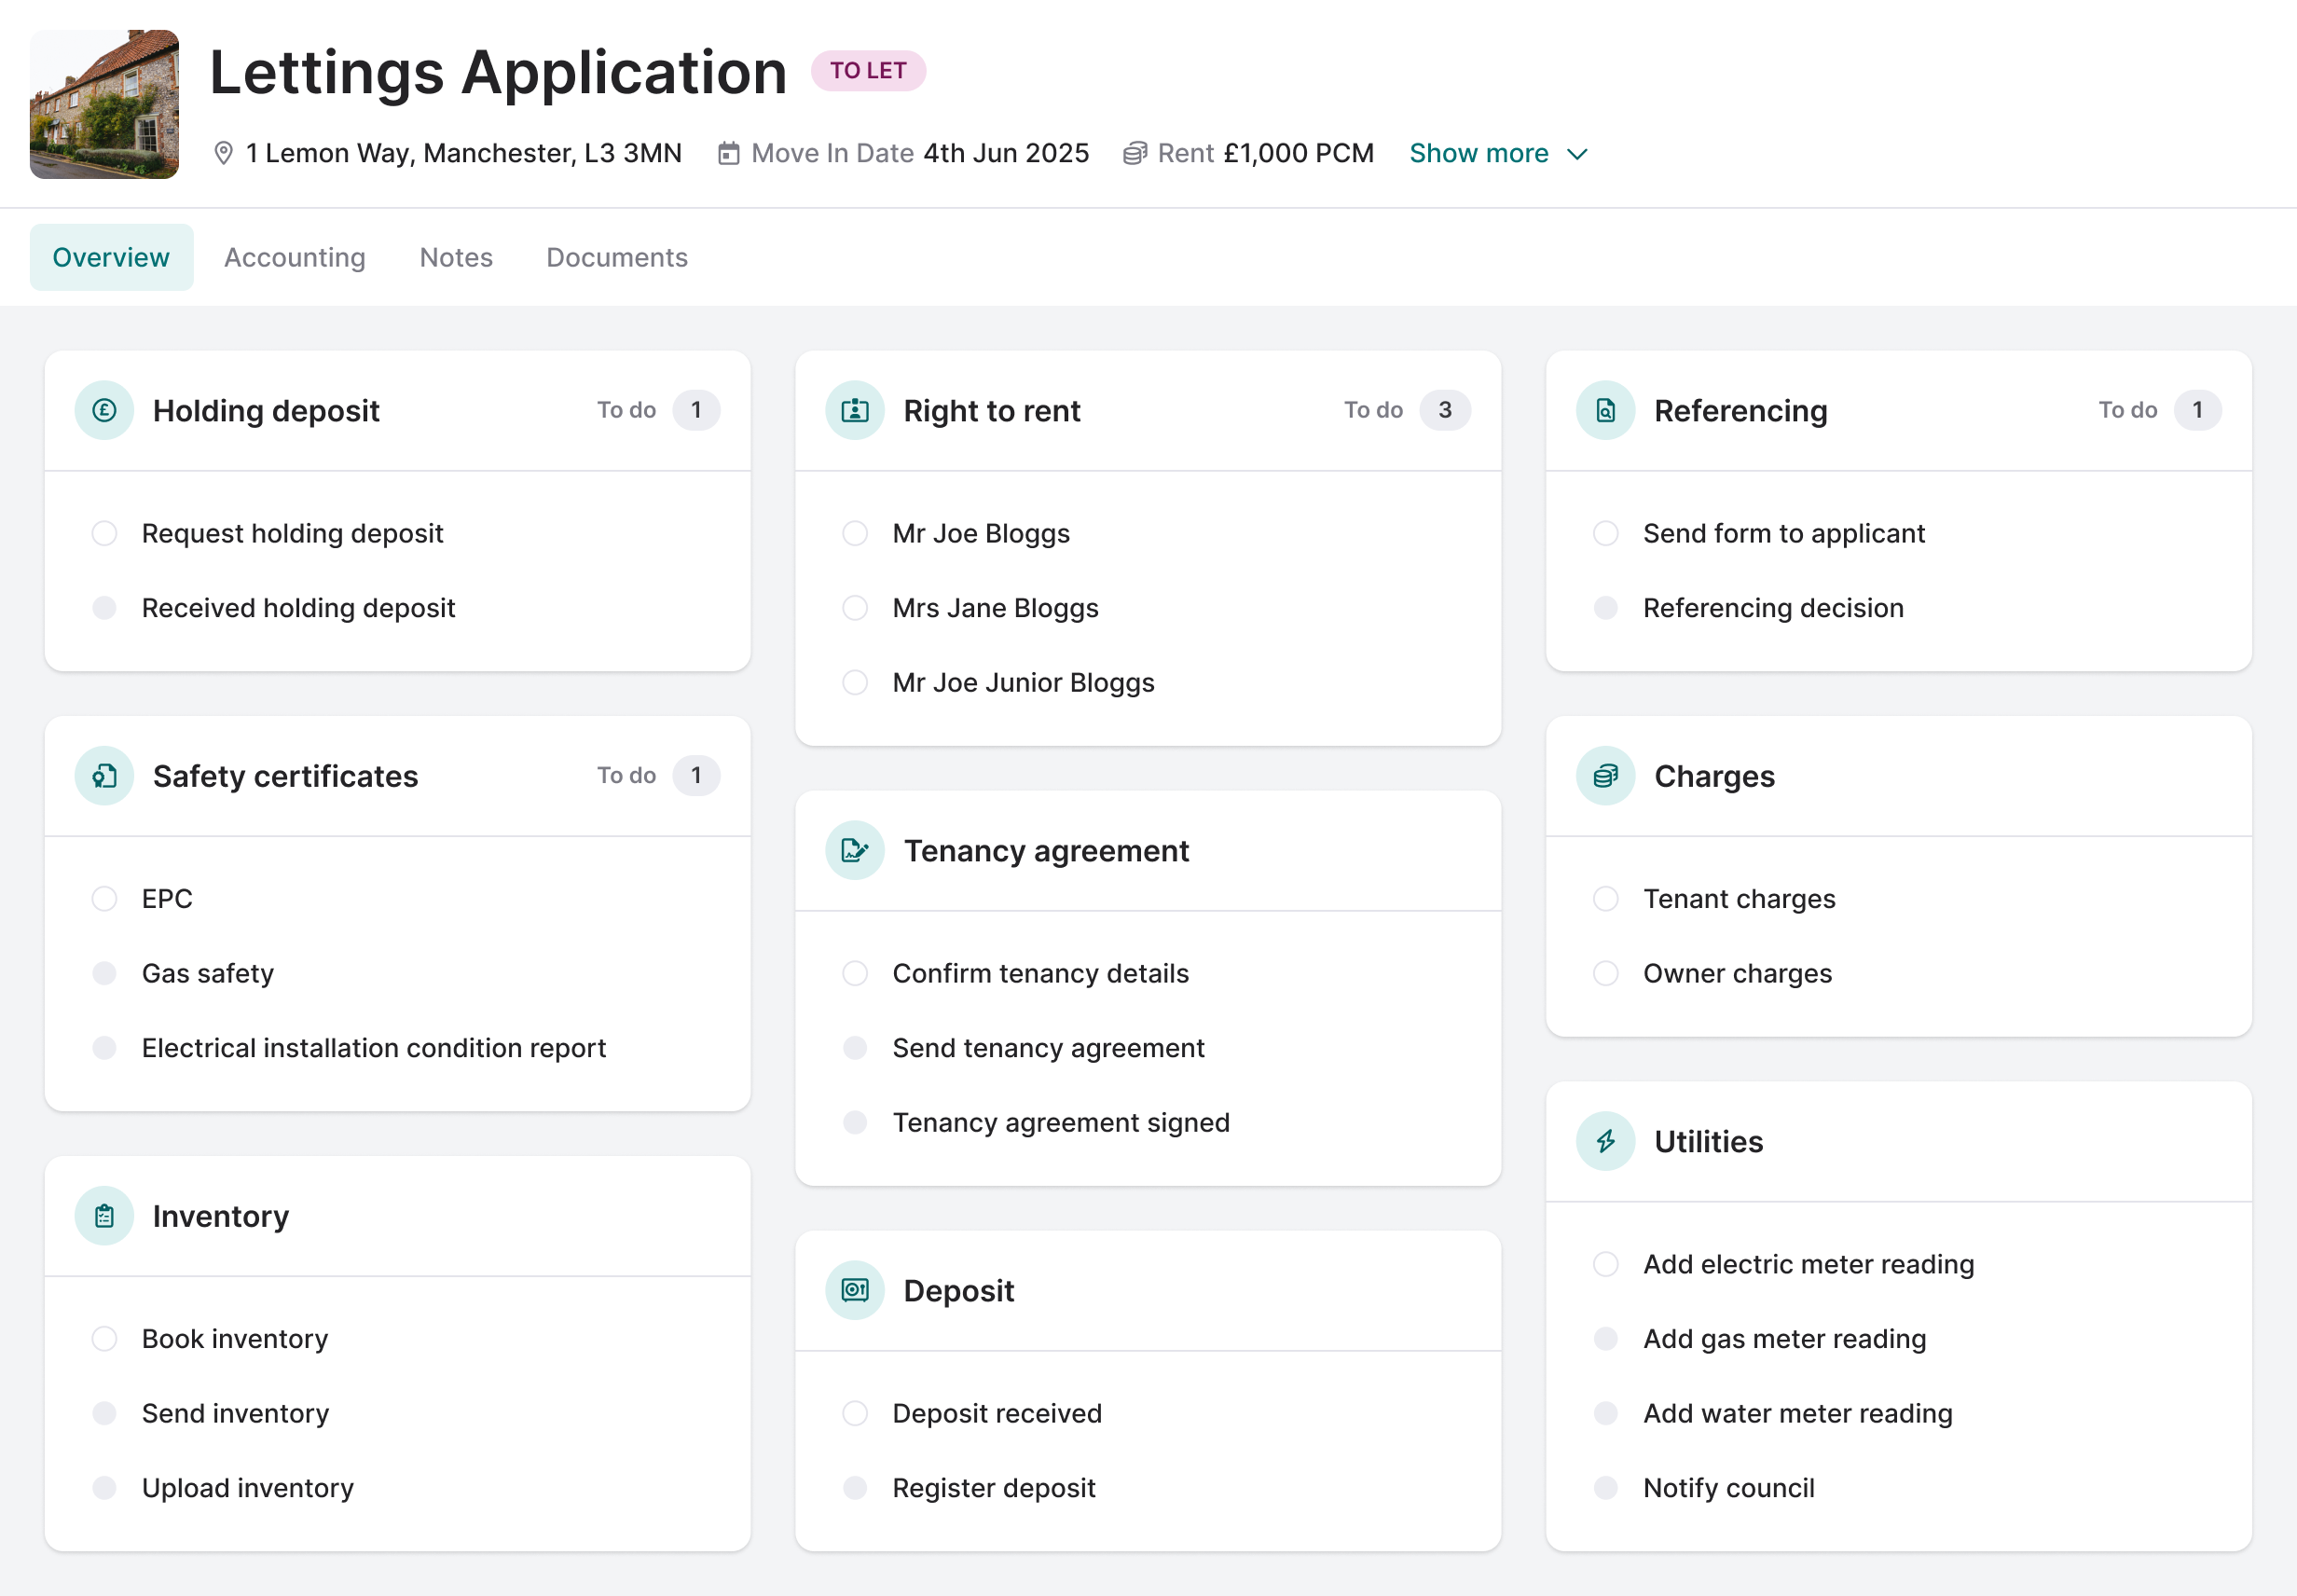
Tasks on the dashboard. In the flow of the day.
A dashboard shouldn't just tell you what happened last week. Pin a task widget to the top and your team opens Street.co.uk straight to the work that needs doing.
- Today's tasks, up top: A task widget on a negotiator's dashboard puts the day's list in the first thing they see.
- Overdue surfaced: Anything that's slipped shows clearly, so it doesn't stay slipped.
- Linked to records: Every task on the dashboard links back to the contact, property or tenancy it's against. One click straight to the work.
"
"For this, Street.co.uk is great as we have dashboards and leaderboards, so we always know where we're up to. The team always has the leaderboard up and it's created some healthy competition internally, and this enhances what the team does."
Paul Mulligan, Managing Director, Move Revolution
RELATED FEATURES
Frequently asked questions
As many as you need. Build one for the business, one for each branch, one for each team, one for each person. Dashboards are unlimited.
Over 50 widgets across KPIs, goals, leaderboards and task lists. Sales metrics, lettings metrics, pipeline widgets, performance widgets. Drag them onto any dashboard and resize them to fit.
Yes. Personal dashboards belong to the person. They can pick widgets, lay them out and track their own goals, separate from the dashboards the business runs.
Yes. Leaderboards can be scoped to a branch, a team or the whole company, and ranked on any trackable metric. One widget can surface several comparisons depending on how it's filtered.
Yes. Dashboards read from your Street.co.uk data directly. There's no overnight refresh and no stale numbers. What the dashboard shows is what's true right now.